Extreme temperatures and heat stress in urban public spaces
Rising temperatures as a result of global warming may have a particularly negative impact on the urban population in the future, as the effect of urban heat islands leads to greater warming of urban areas compared to rural surroundings. Local thermal stress is categorised using bio-medical thermal indices (Migliari et al. 2022), such as the Physiologically Equivalent Temperature (PET) or the Universal Thermal Climate Index (UTCI). These indices are based on meteorological measurements and describe the response of the human body to various meteorological stimuli using models of human thermoregulation and clothing models. Spatial information on heat waves and temperature extremes can be derived from the land surface temperature (LST) data recorded by satellites. One aim of this project is to link these differently scaled parameters in order to investigate the large-scale assessment of the impacts and perception of heat waves in urban areas.
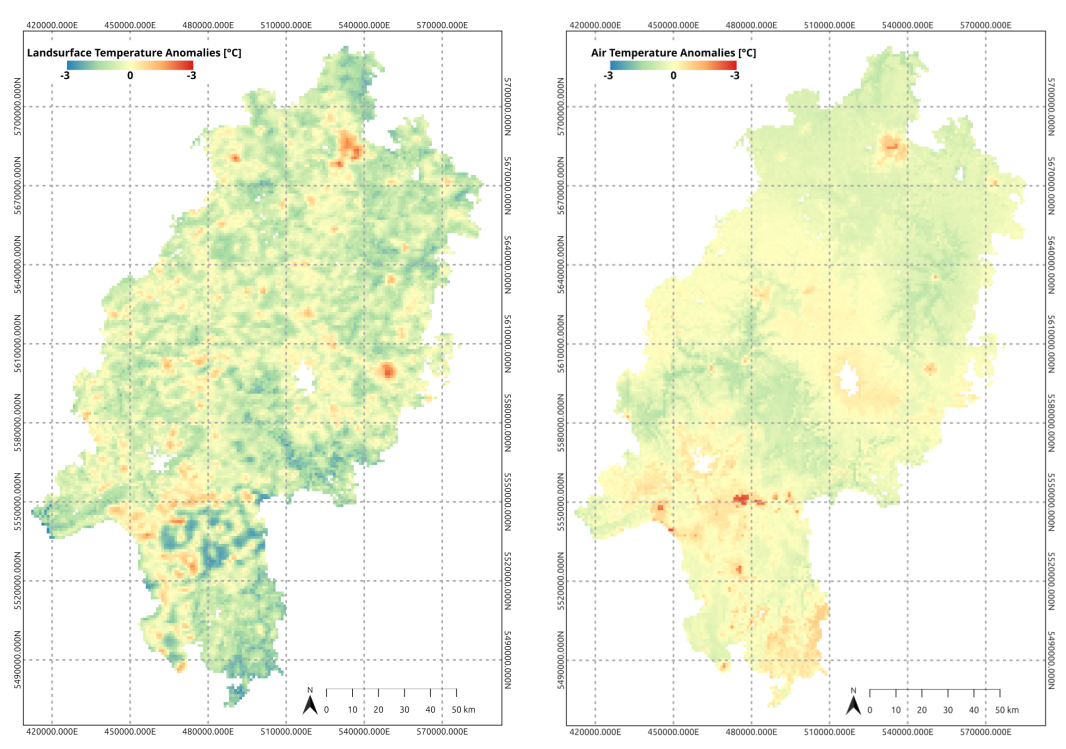
Using the example of Hessen (Figure 1), the project first examines on a regional level the extent to which there is a correlation between perceived thermal comfort and remotely sensed parameters. Among other things, various temporal aggregations and metrics are used to calculate the intensity of the urban heat island and compared with each other. Taking into account the population structure, regions with an increased risk can be identified (Li et al. 2023). Narrow urban street canyons and open squares possess different heat radiation and heat storage properties; however, the spatial resolution of satellite data is often too low to capture these details adequately. Therefore, it is necessary to integrate additional, higher resolution data sources, such as digital surface models (DSM), to accurately map local conditions. For an analysis of intra-urban heat islands and global comparability, the definitions of local climate zones (LCZ) provided by Stewart and Oke (2012) are used, allowing for the classification of urban structure types based on their methodological properties.

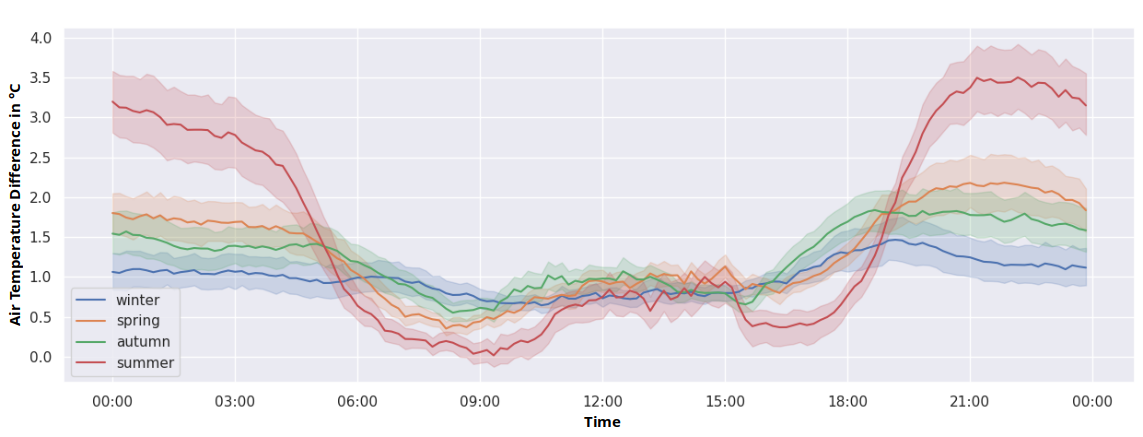
The focus is also on the local level and on public spaces such as pedestrian areas and urban squares. The meteorological variables needed to calculate the UTCI - air temperature, relative humidity, wind speed and mean radiation temperature - are recorded in various urban areas of Karlsruhe. An example of the characteristics of the urban heat island effect for the city of Karlsruhe is shown in Figure 2.

References
- Stewart, I. D., and T. R. Oke. 2012. “Local Climate Zones for Urban Temperature Studies.” Bulletin of the American Meteorological Society 93 (12): 1879–1900. https://doi.org/10.1175/BAMS-D-11-00019.1.
- Li, Jiufeng, Wenfeng Zhan, T. C. Chakraborty, Zihan Liu, Huilin Du, Weilin Liao, Ming Luo, et al. 2023. “Satellite-Based Ranking of the World’s Hottest and Coldest Cities Reveals Inequitable Distribution of Temperature Extremes.” Bulletin of the American Meteorological Society 104 (7): E1268–81. https://doi.org/10.1175/BAMS-D-22-0233.1.
- Migliari, Matteo, Rémi Babut, Camille De Gaulmyn, Loïc Chesne, and Olivier Baverel. 2022. “The Metamatrix of Thermal Comfort: A Compendious Graphical Methodology for Appropriate Selection of Outdoor Thermal Comfort Indices and Thermo-Physiological Models for Human-Biometeorology Research and Urban Planning.” Sustainable Cities and Society 81 (June):103852. https://doi.org/10.1016/j.scs.2022.103852.
Associated institute at KIT: Institute of Photogrammetry and Remote Sensing (IPF)
Author: Svea Krikau (June 2024)

